描述
The following bullets present selected highlights from the report:
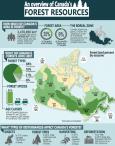
- Canada is rich in forest resources. In 2015, the country's 3.47 million km2 of forest—located in the boreal and temperate zones—accounted for 9% of forests worldwide and 35% of the country's total area.
- The boreal zone covers over 5.5 million km2 of Canada—from Newfoundland and Labrador to the Yukon—including all or substantial parts of ten ecozones. More than three-quarters of Canada's forest is located in the boreal zone. Canada has some of the largest areas in the world of remote and inaccessible forest landscapes.
- Coniferous forests account for 68% of Canada's forest area with spruce forests being the most common. Spruce forests are particularly characteristic of the boreal zone, accounting for large proportions of forest area in the Taiga Cordillera (89%), Hudson Plains (89%), Taiga Shield (86%) and Taiga Plains (85%).
- Insect outbreaks damaged an estimated 176,318 km2 of forest in 2015. The largest proportions of damage were caused by the eastern spruce budworm (38%) and the forest tent caterpillar (29%).
- In 2015, 7,140 wildfires burned a total of 38,616 km2 of forest land—49% were started by lightning strikes, 48% had a human source of ignition and the remainder had an unknown cause. Fires started by lightning were responsible for the majority of the burned area.
- In 2015, Canada harvested 7,796 km2 of forest, which accounted for 0.2% of Canada's 3.47 million km2 of forest area. Clearcutting was the most common method and was used to harvest 6,608 km2 of forest—85% of the total harvested area in Canada.
- Canada's forest area decreased 0.3% from 3.483 million km2 in 1990 to 3.471 million km2 in 2015. Over this period, most forest converted to other land uses was used for agriculture (42%), mining, oil and gas (24%), built-up area (16%), hydro-electric infrastructure and reservoirs (13%) and forestry roads (6%).
- The value of Canada's accessible timber stocks—a component of natural resource wealth—was estimated at $215.4 billion in 2016.
- The total volume of roundwood harvested in Canada was 160.5 million m3 in 2015, up 35% from the most recent low in 2009. By volume, British Columbia accounted for the greatest proportion at 42%, followed by Quebec (18%) and Alberta (17%).
- In 2014, gross domestic product (GDP) for the forest sector in Canada was $22.1 billion with wood product manufacturing responsible for 39% of this total, followed by paper manufacturing (36%), forestry and logging (17%) and support activities for forestry (8%). The forest sector's overall contribution to GDP has declined, from 1.7% in 2007 to 1.2% in 2014.
- As a proportion of total Canadian exports, forest products including logs and pulpwood, lumber and pulp and paper, have declined from 12% in 1997 to 6% in 2016. In 2016, exports were valued at $29.5 billion, with exports of lumber, sawmill and millwork products and pulp and paper accounting for the large majority of this total.
- While the number of forest sector jobs has declined 42% since 1997, the sector continues to be an important provider of jobs and income—providing Canadians with 205,660 jobs in 2016 that had a total compensation valued at $16.0 billion, 1.5% of all compensation in Canada.
- The forest sector was a major economic driver for 105 communities in 2016 compared to 463 in 2001. Increasingly, communities that receive a significant proportion of their income from the forest sector are smaller. The overall share of forest sector employment income generated by these forest sector-based communities decreased from 30% in 2000 to 11% in 2015.
- The forest sector was responsible for 4% of total Canadian water use in 2013 and greenhouse gas emissions associated with the sector totalled 39,931 kt in 2015, 5% of total industrial and household emissions. Environmental protection expenditures by the sector totaled $659.2 million in 2014.
- Linear features from roads, rail lines, electrical transmission lines and cutlines contribute to habitat fragmentation. While linear feature density is highest in more densely populated ecoregions, it is also elevated in other less densely populated areas including parts of the Boreal Plains and Taiga Plains ecozones, largely due to the influence of seismic lines for resource-based activities.
- Canada's forests are adapted to climate conditions associated with their specific geographic area, and as the climate changes, forests will change in response. From 1948 to 2016, the average annual temperature in Canada increased by 1.7 °C with all 11 of Canada's climate regions experiencing temperature increases during this time period.
- In 2006, 240,410 km2 or 7% of Canada's total forest area was protected, for example, in conservation areas and large national, provincial and territorial parks. The proportion of protected area was highest for older forests—27% for stands aged 181 to 200 years, followed by 18% for stands aged 161 to 180 years and 16% for stands aged over 200 years.
目錄


