U.S. home price growth decelerated in June and home prices grew at a single-digit annual rate for the first time in the past 23 months. As housing demand is softening, with declines for existing home sales and new home sales and weakened single-family starts, home price growth is expected to slow. In July, all the 20 metro areas experienced significant deceleration, according to the National Association of Home Builders (NAHB).
The S&P CoreLogic Case-Shiller U.S. National Home Price Index, reported by S&P Dow Jones Indices, rose at a seasonally adjusted annual growth rate of 4.0% in June, following a 16.1% increase in May. It marks the first single-digit annual growth rate since July 2020. Home prices have increased at double-digit annual rates for the past almost two years, about 19.7% growth rate on average. National home prices are now 66.1% higher than their last peak during the housing boom in March 2006.
On a year-over-year basis, the S&P CoreLogic Case-Shiller U.S. National Home Price NSA Index posted an 18.0% annual gain in June, after a 19.9% increase in May. Year-over-year home price appreciation slowed for the second consecutive month.
Meanwhile, the Home Price Index, released by the Federal Housing Finance Agency (FHFA), increased at a seasonally adjusted annual rate of 1.0% in June, following a 16.4% increase in May. On a year-over-year basis, the FHFA Home Price NSA Index rose by 16.2% in June, following a 18.3% increase in May. The FHFA thus confirmed the slowdown in home price appreciation.
图像: NAHB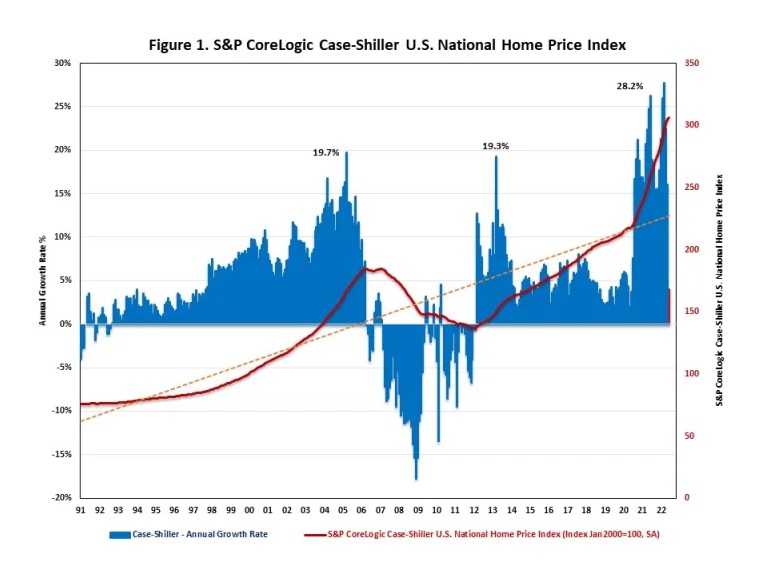
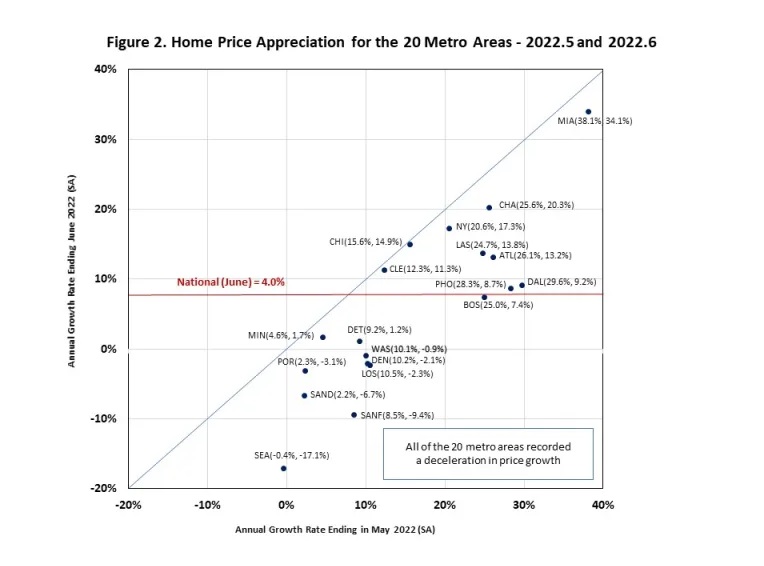
In addition to tracking national home price changes, S&P CoreLogic reported home price indexes across 20 metro areas in June. While seven out of 20 metro areas reported negative home price appreciation, 13 metro areas had positive home price appreciation. Their annual growth rates ranged from -17.1% to 34.1% in June. Among all 20 metro areas, 11 metro areas exceeded the national average of 4.0%. Miami led the way with a 34.1% increase, followed by Tampa with a 30.5% increase and Charlotte with a 20.3% increase. Seven metro areas experienced price declines in June and they are Seattle (-17.1%), San Francisco (-9.4%), San Diego (-6.7%), Portland (-3.1%), Los Angeles (-2.3%), Denver (-2.1%) and Washington, DC (-0.9%).
The scatter plot below lists the 20 major U.S. metropolitan areas’ annual growth rates in May and in June 2022. The X-axis presents the annual growth rates in May; the Y-axis presents the annual growth rates in June. All the 20 metro areas had a deceleration in home price growth in June.
图像: NAHB