S&P Dow Jones Indices (S&P DJI) has unveiled the latest findings from the S&P CoreLogic Case-Shiller Indices, offering valuable insights into the state of the U.S. housing market for July 2023. The data showcases remarkable growth in home prices across major metropolitan areas.
In July 2023, an impressive 19 out of the 20 major metro markets recorded month-over-month price increases. This positive trend indicates a robust performance in the housing sector.
The S&P CoreLogic Case-Shiller U.S. National Home Price NSA Index, encompassing all nine U.S. census divisions, reported a substantial 1.0% annual change in July, marking a notable improvement from the previous month's 0% change. The 10-City Composite demonstrated a 0.9% increase, reversing a -0.5% loss in the preceding month. Equally promising, the 20-City Composite exhibited a year-over-year increase of 0.1%, showing recovery from a loss of -1.2% in the prior month.
Leading the charge for the third consecutive month were Chicago, Cleveland, and New York, all reporting substantial year-over-year gains in July. Chicago secured the top spot with a remarkable 4.4% year-over-year price increase, followed closely by Cleveland with a 4.0% increase, and New York in the third position with a 3.8% increase. Among the 20 cities, 8 reported lower prices, while 12 reported higher prices for the year ending July 2023 compared to the year ending June 2023. Impressively, 18 out of the 20 cities demonstrated a positive trend in price acceleration compared to the previous month.
Image: The chart compares year-over-year returns of different housing price ranges (tiers) for Chicago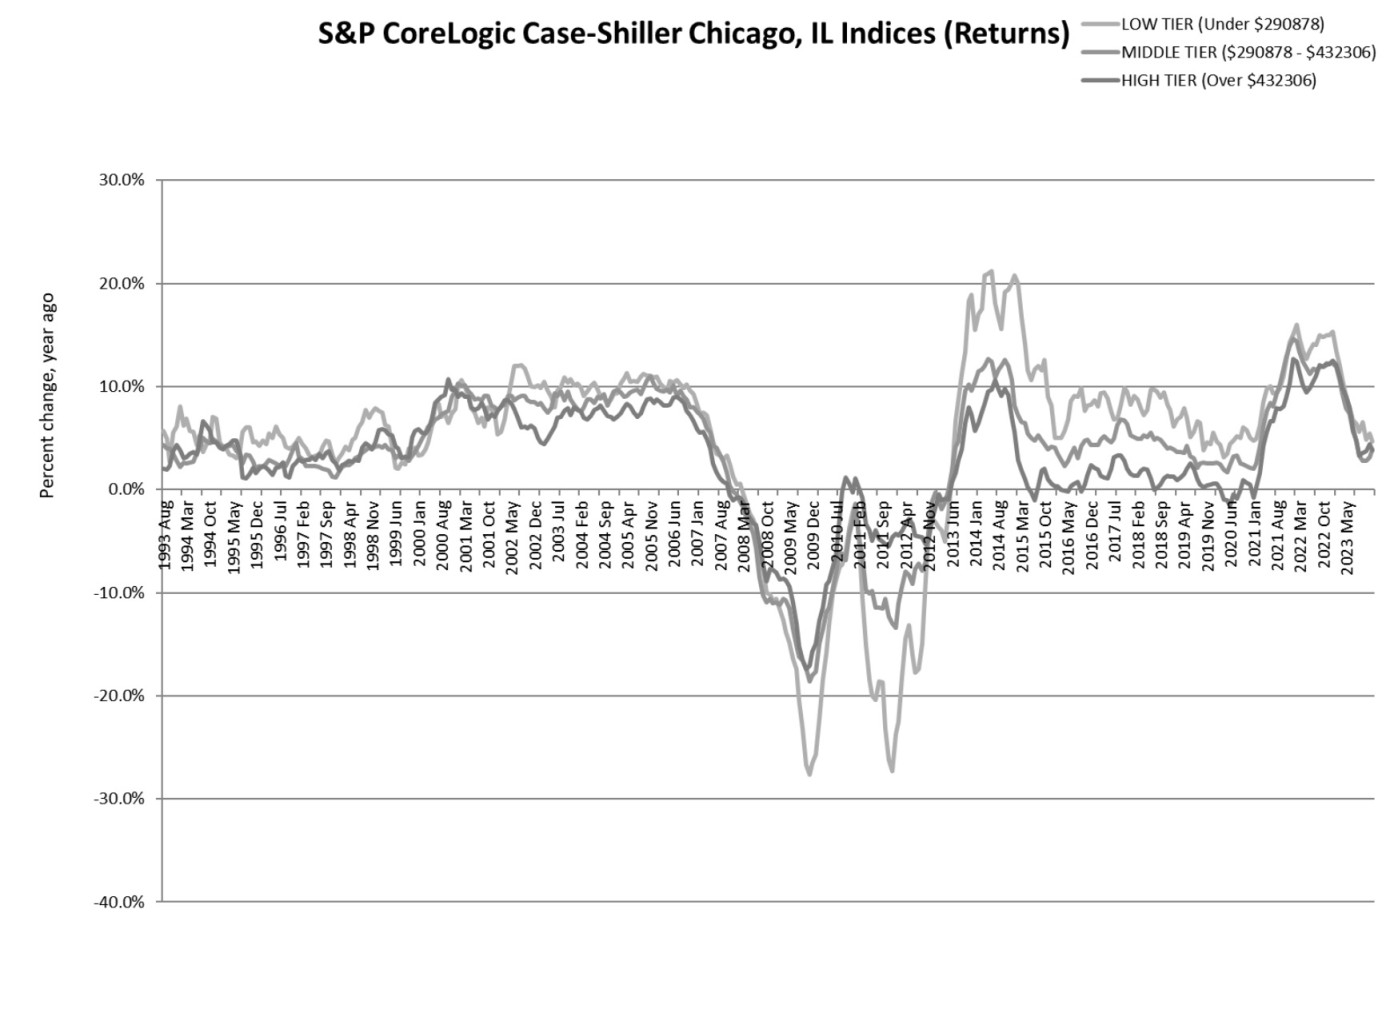
Before seasonal adjustment, the U.S. National Index, 10-City, and 20-City Composites all saw a significant 0.6% month-over-month increase in July.
After accounting for seasonal adjustment, the U.S. National Index posted a month-over-month increase of 0.6%, with the 10-City Composite showing a 0.8% increase and the 20-City Composite displaying a 0.9% increase.
Craig J. Lazzara, Managing Director at S&P DJI, commented on the findings, stating, "U.S. home prices continued to rally in July 2023. Our National Composite rose by 0.6% in July, and now stands 1.0% above its year-ago level. Our 10- and 20-City Composites each also rose in July 2023, and likewise stand slightly above their July 2022 levels. We have previously noted that home prices peaked in June 2022 and fell through January of 2023, declining by 5.0% in those seven months. The increase in prices that began in January has now erased the earlier decline, so that July represents a new all-time high for the National Composite."
The report highlights regional differences, with the "Revenge of the Rust Belt" cities, including Chicago, Cleveland, and New York, continuing to lead the year-over-year gains. On the flip side, Las Vegas and Phoenix reported the lowest performance in July.
It's worth noting that all cities at all-time highs are in the Eastern or Central time zones, emphasizing regional variations in the housing market's performance. The Midwest remains the strongest region, with the West and Southwest lagging behind.
On a year-to-date basis, the National Composite has experienced a remarkable 5.3% increase, surpassing historical trends.