U.S. softwood lumber demand moves more with residential construction than with GDP per capita or lumber prices when housing starts are included directly in the demand equation, a new study finds. Using quarterly U.S. data from 2000 to 2024, the study estimates a housing-starts elasticity of 0.593 for apparent softwood lumber consumption, compared with an income elasticity of 0.138 and a price elasticity of -0.212, then applies those elasticities in a forest-sector model to project outcomes through 2070 under five scenarios. This is reported in a study conducted by Craig Johnston, an independent researcher in Ottawa, Jinggang Guo of Louisiana State University’s Department of Agricultural and Agribusiness, and Jeffrey P. Prestemon of the U.S. Forest Service Southern Research Station.
The housing data used in the study show U.S. total housing starts (single-family plus multifamily) averaged 1,305.8 thousand units (seasonally adjusted annual rate) over 2000–2024, with the quarterly sample ranging from a maximum of 2,120 thousand to a minimum of 526 thousand. The study also describes a cycle in which starts peaked above 2.0 million units in 2005 before falling to about 0.54 million units in 2010.
The authors incorporate housing starts into the Forest Resource Outlook Model by adding housing activity alongside GDP per capita growth and price changes in the model’s demand updating equation. They say the older model setup, which relies on GDP per capita and prices without housing starts, projects rising U.S. consumption after 2015, while the revised setup produces demand that falls gradually and aligns more closely with FAOSTAT observations in the most recent decade. Image: United States softwood lumber demand and production. Historical from 1990 to, 2015, FOROM projections from 2020 to 2070 under SSP2 / Forest Policy and Economics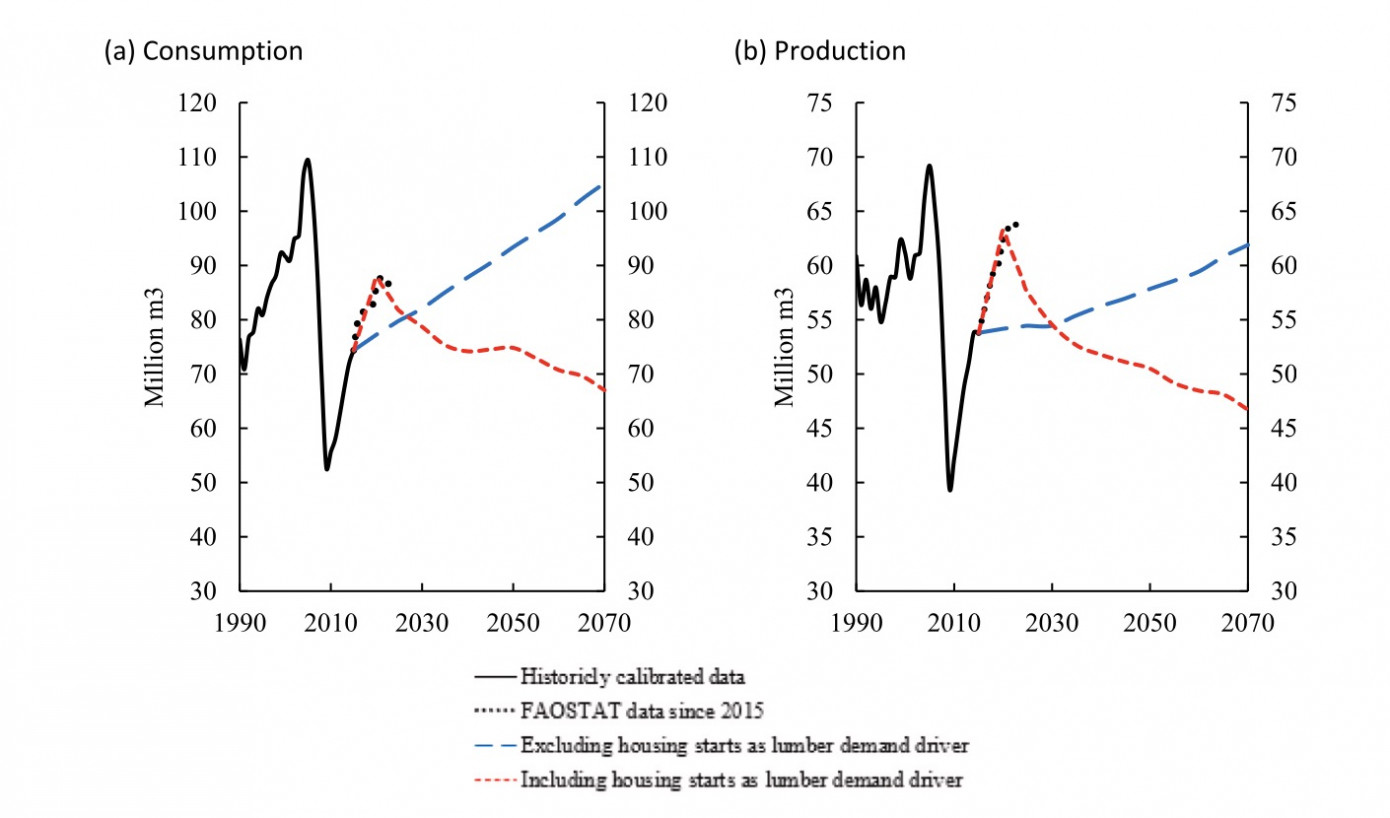
The study links its scenario housing paths to a projection framework that models housing starts as a function of the change in real GDP, the change in population, the mortgage delinquency rate, and the mortgage interest rate. It says these projections extend housing-market volatility into the long run and maintain downward pressure on housing starts across all five scenarios.
In the five scenarios, the model projects U.S. softwood lumber consumption declines by 2070, with the scenario 5 outcome the highest, the scenario 3 outcome the lowest, and scenarios 1, 2, and 4 in between. The study says the lowest case takes consumption to around 60 million m3 by 2070.
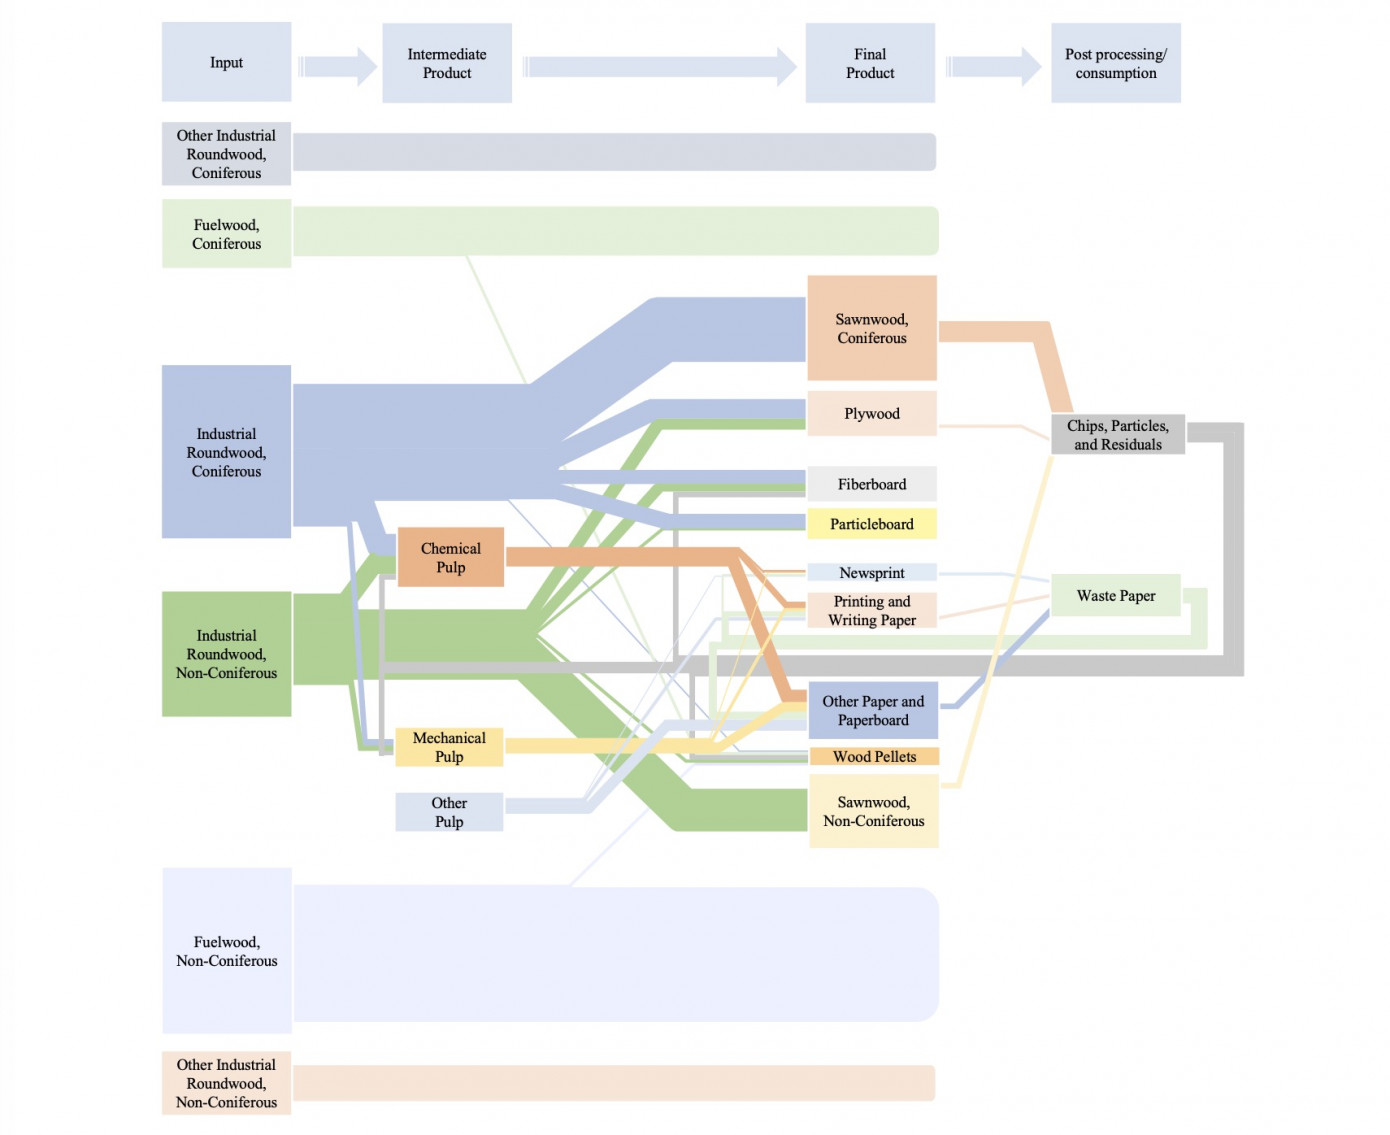
Regional results show the largest reductions concentrated in the U.S. South by 2070, while the Pacific Coast is described as more resilient than the South. Under the lowest scenario (scenario 3), South East housing starts fall from 327.6 thousand units in 2020 to 111.0 thousand units in 2070, and South Central starts fall from 276.8 thousand to 92.7 thousand. In the same scenario, South East softwood lumber consumption falls from 14.3 million m3 in 2020 to 10.1 million m3 in 2070, and South Central consumption falls from 15.1 million m3 to 10.1 million m3, while Pacific Coast consumption moves from 27.9 million m3 to 19.6 million m3. Image: Forest product flow chart in the FOrest Resource Outlook Model (FOROM) / Forest Policy and Economics